

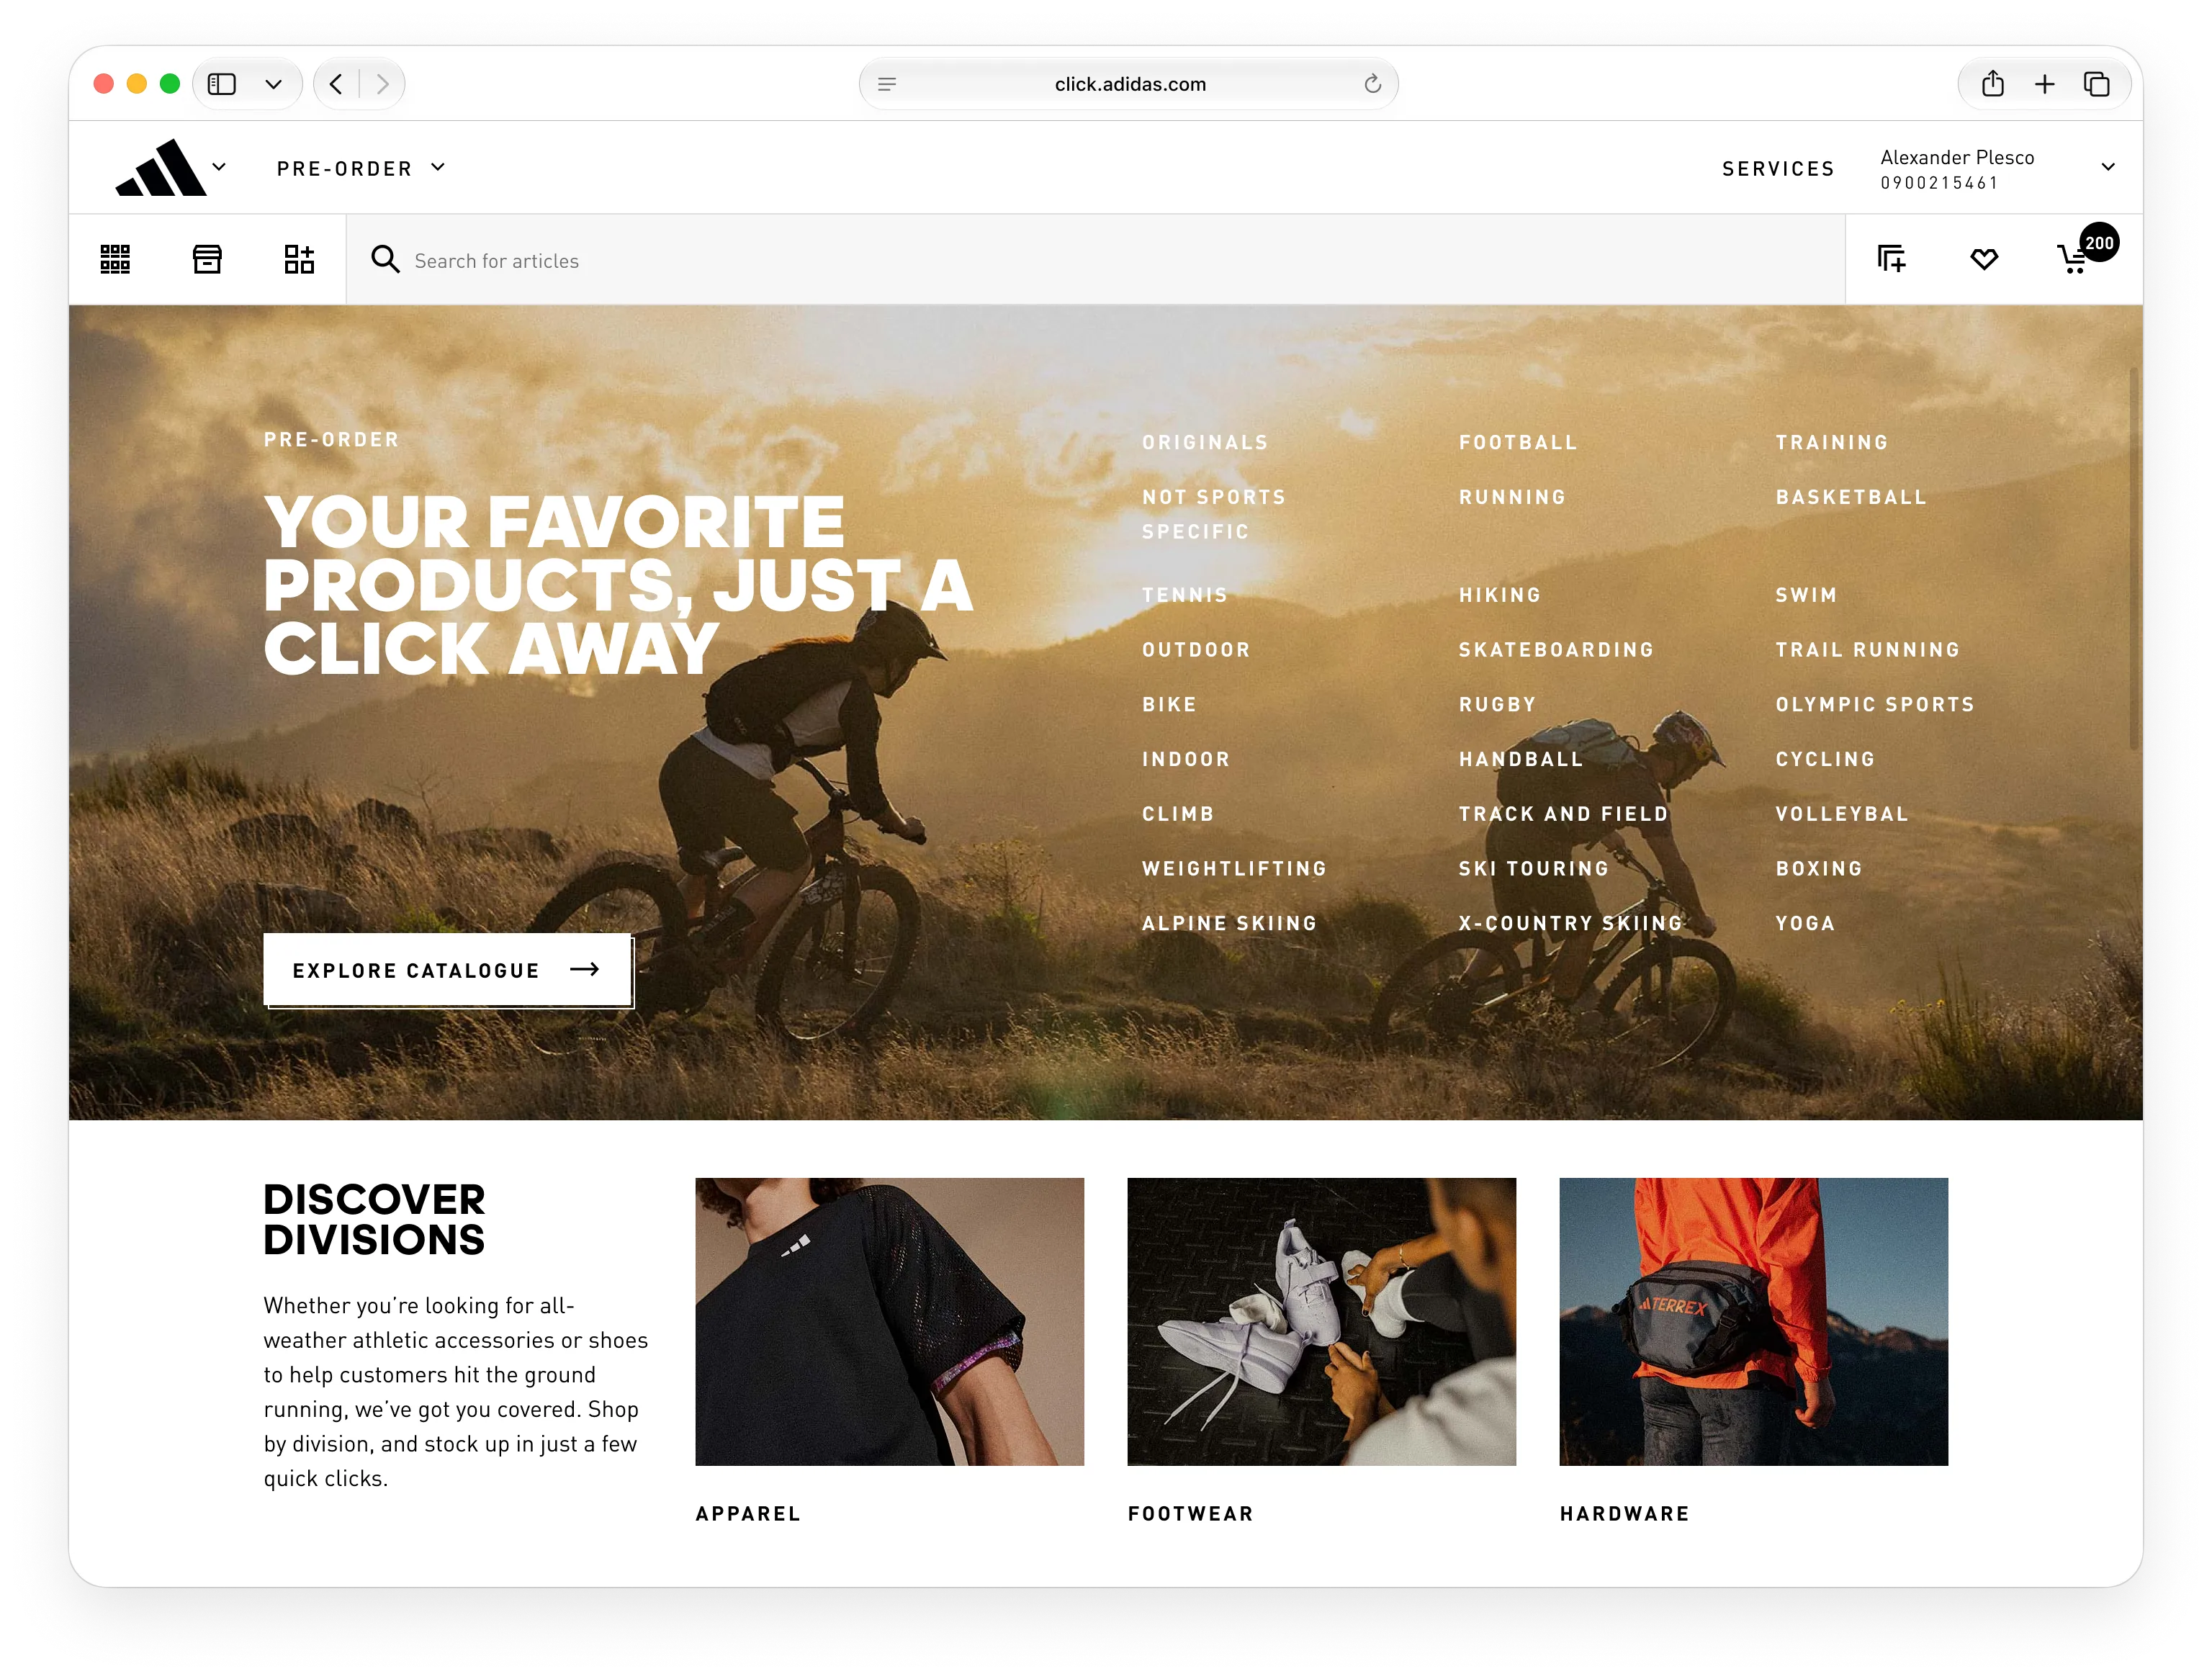
adidas’s¹ flagship B2B e-commerce platform lets retailers pre-order large product quantities for upcoming seasons. The goal was to support its expansion into North American (NAM) and Latin American (LATAM) markets by redesigning the ordering journey to reduce friction for large enterprise clients. The project started in spring 2021. It was the first time the B2B product department had ever talked directly to the people using the platform about their experience, and we led those conversations. Researching with real buyers from 26 countries helped us reshape it. Product revenue grew from €380M to almost €1B, and our work was part of that growth.
- role
- UX team lead, researcher and research coordinator with a sister product’s design team
- team
- 6 UX designers, 4 product managers
- timeline
- ~5 months
- methods
- User interviews, focus groups, enterprise Design Sprint, usability testing
Problem
Large retailers ordered whole seasons in Excel², because the shop was too slow for bulk orders: one login per account, no copying carts, addresses locked to contracts. Sales reps typed the orders in for them.
Solution
We researched with 56 buyers in 26 countries, then rebuilt ordering to work like a spreadsheet, with mass edit, copy cart, multiple logins, bulk shipping, drop-ship and Excel export.
Results
€380M → ~€1B product revenue (2019–21). Our work was part of that growth. Launched in North and Latin America. Sales reps moved from data entry to account management.
TL;DR the short version
- The ask
- adidas’s B2B ordering platform already worked in EMEA (Europe, the Middle East and Africa). The goal was to take it to North and Latin America. North America paid to maintain its own ordering tool for sales reps, and Latin America couldn’t make the global platform work. Once it worked there, North America dropped its own tool.
- What research showed
- Buyers wanted familiar, not modern. 56 buyers in 26 countries kept ordering in Excel because the shop was too slow for bulk orders: one login per account, no copying carts, delivery addresses locked to contracts.
- What we designed
- Ordering that works like a spreadsheet: mass edit, copy cart, multiple logins, bulk shipping, drop-ship and Excel export. One 1.5-week Design Sprint got engineering, product and sales to agree on a flow, and 14 participants tested it in 3 rounds while we designed.
- Impact
- Product revenue grew from €380M (2019) to almost €1B (2021), and our work was part of that growth. Launched in North and Latin America. Sales reps moved from data entry to account management.
- What stayed
- The process outlived the project: after we left, adidas’s whole B2B department kept designing with it.
01 — the challenge
adidas was expanding. its ordering wasn’t ready.
manual ordering designed for Europe couldn’t scale to new markets
Each market hit a different wall.
North America (NAM)
North America’s sales reps already had an ordering tool of their own, which the market kept paying to maintain. To move them to the global platform, the new shop had to do everything that tool did. The biggest gap was drop-shipping (sending an order straight to a customer’s address, not the store), which the cart didn’t support. Once the global shop rolled out there, North America dropped its own tool.
Latin America (LATAM)
Retailers with many stores had to build the same order again for each one, because there was no “Copy Cart” and no way to change shipping locations in bulk. One retailer with 120 stores logged in 120 times a season to place its orders.
sales reps were doing the buyers’ data entry
The support bottleneck
Because the tool wasn’t truly self-service, adidas relied on many sales reps to place orders for customers by hand.
The seasonal crunch
This manual support was unsustainable during the short, high-pressure pre-season buying windows. adidas needed a tool that let retailers order on their own, freeing up sales reps for strategic tasks rather than data entry.
02 — what it depended on
before designing anything, we asked why buyers avoided the shop
Research goal
To analyze the purchasing habits of high-volume buyers and understand why they prefer offline tools (like Excel) over the platform’s native cart.
Main objective
Map how buyers place a big order from start to finish, and find where the shop slows them down.
a process the whole department kept using
Before kicking off the project, we outlined our proposed approach: the Enterprise Design Sprint (a Design Sprint that follows the method but is flexible to the big corporate pace), which would come after a series of user interviews and focus groups.
We started with , then a . After that, for every new OKR*, again and again: , , , and a .
Step 01: User research
56 buyers, 26 countries, 6 languages. Why did the biggest buyers still order in Excel?
- how long
- 4 weeks
- what came out
- Four key findings and the buyers’ needs.
Step 02: Design Sprint
Engineering, product, sales and design agreed on one ordering flow. Planned for 4 days.
- how long
- 1.5 weeks
- what came out
- One user flow, agreed and ready for testing.
Step 03: Story mapping
Product led workshops with UX and dev to decide what to design and test first.
- how long
- a few days
- what came out
- A prioritized backlog and a sequenced list of OKRs.
Step 04: Technical analysis
Design presented mockups and asked questions; the technical team flagged constraints and dependencies and validated what was feasible.
- how long
- 1–2 calls per OKR
- what came out
- A clear answer on what could be built now, and what needed more work.
Step 05: Design phase
Turning the sprint’s raw user journeys into real designs: UX workshops, technical sync with front and back end, mockups, a KPI session, component reviews and usability testing.
- how long
- 3 months
- what came out
- Mass edit, Excel export, multiple logins and the rest, spread across a 6-month backlog.
Step 06: Dev phase
Engineering built the solution; design reviewed it for visual QA, checking the build matched the design.
- what came out
- A list of fixes, prioritized with product into before-launch and after-launch.
Step 07: Post-launch analysis
The plan: check the KPIs set in design, watch qualitative signals (interviews, usability tests, heatmaps, recordings) and run A/B tests where quantitative data was needed.
- what came out
- In practice, time and limited analytics meant this rarely ran in full.
OKR: a goal with measurable results a team commits to for a quarter. Each one went through the last five steps.
This process outlived the project. After we left, the whole adidas B2B department, not just our product, kept using it as its main way to design.
03 — what we found
four gaps sent buyers back to Excel
56 buyers in 26 countries, in their own languages
We spent 4 weeks preparing and conducting user interviews and focus groups.
26 countries · 11 focus groups · 56 participants · 6 languages
- Canada
- Mexico
- Panama
- Brazil
- Peru
- Chile
- Argentina
- United Kingdom
- Portugal
- Spain
- France
- Germany
- Italy
- Poland
- Croatia
- Greece
- Israel
- United Arab Emirates
- United States
- South Africa
- Australia
- New Zealand
- Ecuador
- Austria
- Switzerland
- Czechia
what the research actually told us
Our research revealed the gaps preventing global scalability.
Limited enterprise access
The issue: Large customers were restricted to a single login per account, making it impossible for teams to collaborate.
The impact: This bottleneck slowed down decision-making for adidas’s biggest clients, who needed multi-user access to manage complex orders.
Navigation friction & ambiguity
The issue: The cart creation flow was counter-intuitive, and delivery dates were often misinterpreted by buyers.
The impact: Users didn’t know where to start, driving a high volume of “How-to” support calls to the sales team.
Inefficiency for multi-store orders (LATAM)
The issue: Buyers managing multiple storefronts could not duplicate carts; they had to manually rebuild orders for every location.
The impact: This was one of the reasons LATAM buyers abandoned the app for Excel—it was simply too slow to use the platform.
Rigid delivery logic (NAM)
The issue: Delivery addresses were hard-coded to contracts (fixed to the contract, with no way to change them per order), blocking the ability to select custom drop-ship locations.
The impact: This technical constraint was a hard blocker for adopting the drop-shipping model (goods sent straight from the warehouse to the buyer’s customer) required for North American expansion.
Also missing: the formulas and cart-building features North American buyers had in their own tools. adidas’s tool didn’t include them.
3 personas to design for
From the interviews we built 3 personas, one for each kind of buyer we met.
“If I could sort items in the Cart and reuse same quantities for sizes multiple times, it would be a game-changer for me”
William Mayers
New customer, small size
Orders for 10 stores in Europe on a fixed budget. Most of each order repeats the last one, so they type the same items and sizes in every season.
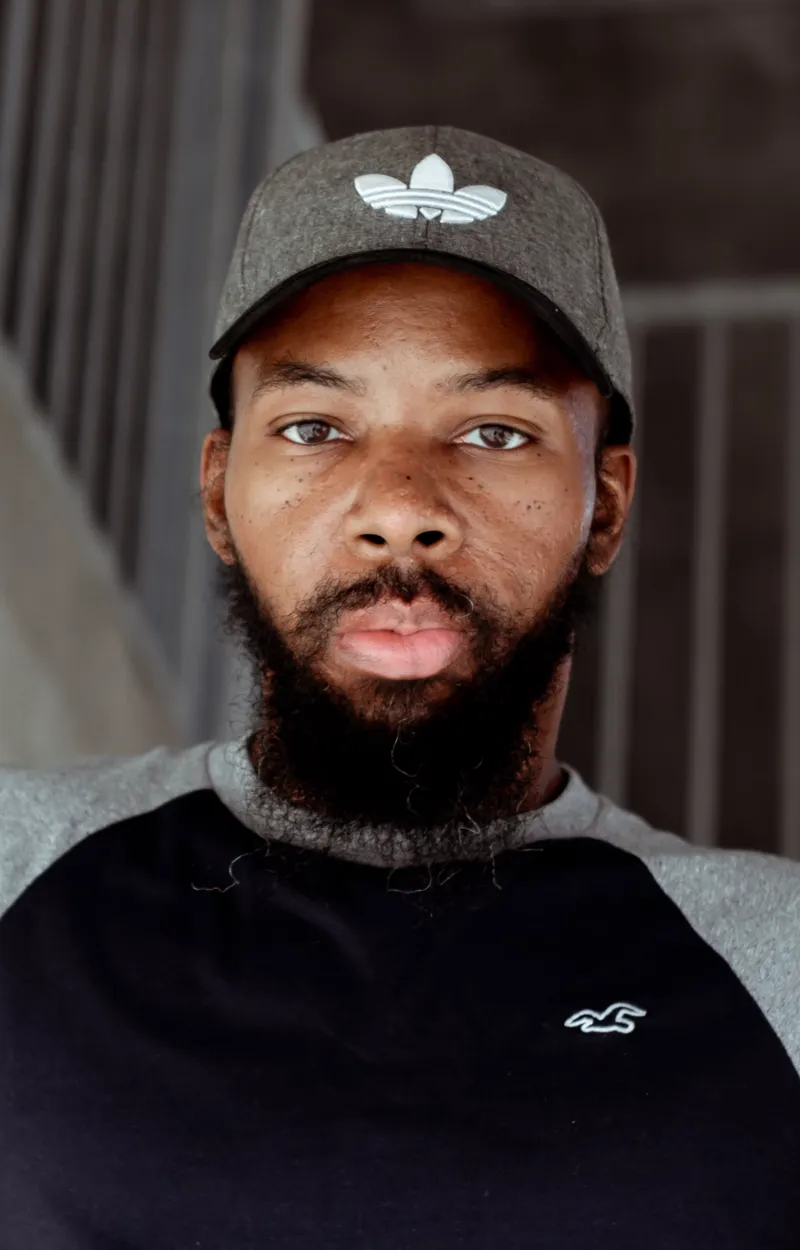
- 10 stores in Europe
- 60% classics, 40% new
- A well-defined budget
Their goals
- Reorder the same items and sizes in a few clicks
- See what each group of items costs
Their main frustrations
- Typing the same quantities again and again
- No view of the budget per group of items
“Planning for reorder and duplicating orders is a nightmare - it lasts for days, sometimes even weeks”
Mark Harrison
Specialist, medium size
Buys men’s apparel for up to 80 stores. Sends the same order to every store, one by one, sometimes logging in as each location, for local regulations.

- Up to 80 stores
- Specializes in apparel for men
- Reorders for specific dates
Their goals
- Build one cart and copy it to every store
- Know when items will be back in stock
Their main frustrations
- Copying an order to each location by hand
- No idea when reorders will be available
“This platform is a deal-breaker for me: I can’t be 100% autonomous and often need the assistance of a sales representative, and it is just a lot of manual work for me.”
Natalie Norman
New customer, big size
Picks the range in the showroom, then orders for 50 of their company’s 200+ stores, with help from sales reps. Every store needs the same new range, in the same sizes.

- 200+ stores, 50 of them theirs
- Works closely with sales reps
- Orders a large number of items
Their goals
- Order large quantities for many locations at once
- See all carts and orders in one place
Their main frustrations
- One order split across several carts, because of the item limit
- Items sell out while the order is still being built
before designing, we checked what was already broken
Simultaneously, the design team conducted a 2-week UX audit and heuristic evaluation (checking the interface against established usability principles), so the redesign wouldn’t repeat the same issues.
UX audit:
- Inconsistent flows
“Pre-order” and “Re-order” followed different logic, confusing users who switched between tasks.
- Lack of guidance
No onboarding, tooltips or “next steps” to guide first-time users.
- Technical debt (old shortcuts in the product that make every change slower and riskier)
We faced broken legacy features, inconsistent components and an interface that ignored basic usability rules.
- Migration
In addition we had a challenge of a massive Sketch³-to-Figma⁴ migration mid-project.
Cross product audit:
- Internal benchmarking
Audited similar features across the company’s portfolio to ensure a unified experience for users who use multiple internal tools.
- E2E (end-to-end) journey mapping
Served as Subject Matter Experts (SMEs, the people who know the product best) to validate the end-to-end customer journey map produced by partner vendors.
- Research standardization
Defined a shared research framework to ensure data consistency across the entire design department.
- Design system unification
Aligned UI components across 3 separate products, laying the groundwork for a shared design system.
04 — what changed
we built a shop that works like their spreadsheet
one sprint to get engineering, product and sales to agree
To tackle the complexity of global requirements without stalling, we aligned engineering, product, sales and design in a 1.5-week workshop.
8 people from engineering, product and sales · 6 designers · 20 hours of workshops
It didn’t go to plan. The sprint was meant to take 4 days, by the book, and it took 1.5 weeks. The people we needed were busy and could only give us a few hours at a time, so the days stretched. We kept it moving by writing every decision down and keeping everyone in the loop.
3 rounds of tests with 14 participants, while we designed
To meet tight deadlines, we ran usability testing in parallel with design updates, iterating through 3 versions with 14 participants.
Parallel execution
We didn’t wait for “perfect” pixels. To iterate faster, we conducted rapid testing cycles simultaneously within the Design Sprint.
Cross-persona validation (testing with more than one type of user)
We tested with a mix of mid-sized and large-sized buyers. In addition we ran some tests with sales reps who were usually assisting customers and were familiar with the product.
two fixes shaped by the research
Solving entry fatigue (the “mass edit” fix)
Users typed quantities (e.g., “2, 2, 2”) into every single cell for large size runs. They could already enter a quantity once for all cells (mass edit), but the design didn’t show it, which made them think they couldn’t. We redesigned mass edit to make it obvious how to populate full size runs in one click, and regrouped the table layout to match how they think about a size run.
Bridging the offline gap (the “Excel” fix)
We identified “Export to Excel” as a safety net: a way to keep their own offline records. With an export feature, users could keep those records while ordering online.
the sprint and its tests set the next 6 months of work
We tested many things in the sprint, then split them into separate initiatives. The tests helped us validate our design solutions, which we documented as 6 months of design work in the backlog. We spent 3 months working on a part of it.
everything the research asked for shipped
The cart page and cart panel redesign (shown in the before/afters), plus mass edit, Excel export, multiple logins, copy cart, bulk shipping and drop-ship, each shipped as its own piece of work, as separate OKRs set after the research.
€380M → ~€1B, and two new markets
- Product revenue
- €380M (2019)
- almost €1B (2021). Our work was part of that growth.
- Bulk orders
- Built in Excel, then typed into the shop
- Built in the shop, faster, with mass edit, copy cart and Excel export
- Sales reps
- Typing in orders for buyers
- Managing accounts
- Markets
- Europe, the Middle East and Africa
- Also North and Latin America, with a base for East Asia-Pacific
05 — role
from a solo designer to a lead of a team of 6
My role
UX team lead, researcher and research coordinator between our team and the design team of a sister product.
Team structure
I led a team of 6 UX designers; collaborated with 4 product managers, several teams of developers and a Design Sprint facilitator.
Methods
User interviews, focus groups, enterprise Design Sprint, usability testing.
Timeline
~5 months
4 weeks for research; 1.5 weeks for the Design Sprint; 3 months for design execution.
On the team
June 2020 to January 2023.
06 — learnings
what big B2B taught us
The power of “Enterprise Sprints”
In a corporate setting with 6 designers, 4 PMs (product managers), the head of product management (B2B), a solution architect, a data analyst and sales operations, traditional workflows can hinder decisions. Running a classical Design Sprint is not feasible; the framework has to be adapted to the enterprise pace.
Data breaks assumptions
We assumed users wanted a “modern” e-commerce experience. Research showed they actually wanted a “boring,” dense, Excel-like utility. This reinforced that user needs (efficiency) must trump aesthetic trends.
The power of transparent communication
In big B2B, the people you need are busy. They can’t give you the time a textbook process assumes, so the Design Sprint Google⁵ invented rarely runs by the book. Documenting decisions and keeping everyone informed is what keeps the work moving when the people you need are only half-available.

¹ adidas and the adidas logo are registered trademarks of adidas AG.
² Microsoft and Excel are registered trademarks of Microsoft Corporation.
³ Sketch is a registered trademark of Sketch B.V.
⁴ Figma is a registered trademark of Figma, Inc.
⁵ Google is a registered trademark of Google LLC.
Persona photos on Unsplash: William by Lisa Coleman, Mark by Julián Gentilezza, Natalie by Mario La Pergola.
All other brands and names belong to their owners, not to it depends. Not sponsored or endorsed by any of them.